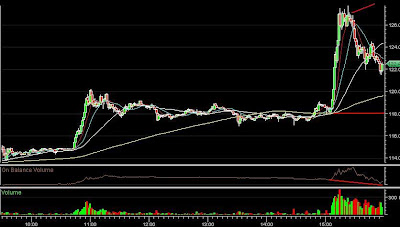
 After price break out(red circle), CMI is pulling back at a horizontal support level. If this level can provide a good support, this stock will have a longer running up.
Sunday, September 30, 2007
CMI: Pull Back at a Support Level
 After price break out(red circle), CMI is pulling back at a horizontal support level. If this level can provide a good support, this stock will have a longer running up.
Saturday, September 29, 2007
USO: Long Term Technical Analysis
 This is a weekly chart of USO in two years. It's very clear USO has formed a solid inverted head-shoulder bottom. If we connected the neck line, we can see that in the red circle the neck line provided a strong support for the short term pull back. Since then, USO has made a good rally.
 Based on the bottom and the neck line, we can obtain an approximate target line and we can also see that the target was reached in the last week. Just because of this reason, USO was very volatile in the last week(see the candle in the yellow circle). The investors were indecisive about wheter taking profit or making new highs.
Also a resistance line is hovering around $65. In short term, it is a challenge for USO. However, in a long term, USO is heading for a price break out.
Friday, September 28, 2007
ICE: Will have a huge run!

On 09/25/2007, ICE was selected as one of the component stocks in the S&P 500 index. On this day, the volume reached nearly 20 million shares and the stock also had a huge jump. The jump brought ICE completely out of the short term down trend channel.
Let's review ICE's past performance first. After its debut, the stock kept running up for almost half a year, then it had a major correction along with the broader market correction in last June. Then ICE soared up for almost 8 months. Then there came a big correction again. A couple months ago, ICE made its all time high again. Since then, it was in a down trend.
From the chart, we can see there are three higher pivot highs and three higher pivot lows(the short red line is a low at close and it's not a pivot low, the long leg is an extreme value). In summary, what ICE did in the past two years was: a short run, a long and big run, and then a healthy consolidation.
Now, the real good news is the huge volume on 09/25/2007. It is almost the same amount as the debut volume. More importantly, it accounts for 1/3 of the total number of outstanding shares. Talking about accumulation, what else can be a larger accumulation than this one? Simply speaking, the supply of this stock will be in short, no matter the demand is up or down. Hopefully, this effect could be seen soon and for a long time.
Thursday, September 27, 2007
RSH: Trend Further Down

Wednesday, September 26, 2007
BSC: Shorters are panic


The big jump today occured around 118 which is close to the average short price in September. This price triggered a set of short covering stop orders, with some fake news, the demand is mainly from shorter side. Then another group of people jumped in and dumped the stock as we can see from the decreasing trend of the OBV at the end of today's session.
Monday, September 24, 2007
SBUX: Uptrend Pressure is still high
Sunday, September 23, 2007
FIG: Short Squeeze should be watched

AA: Long Term TA
 This is a five year weekly chart for AA. In long term, AA is deciding to choose an up trend channel (green) or a down trend channel(red). From several points(green, red lines, and the SMA 20 week curve), we can see $39-$40 will form an important resistance for AA. In short term, this area is also a 50% pull back from the recent lowest low (as blue lines indicate). If AA cannot move above that area, it will pull back again and the next pivot low will determine whehter AA will be in an up trend channel or a down trend channel in a long run.
 Saturday, September 22, 2007
WFMI: Next couple weeks will be vital
 This is a weekly chart of WFMI. WFMI is still in the down trend channel. In the past two months, WFMI tested the EMA 50 week curve three times. To see a trend reversal, WFMI has to move above the EMA 50 week curve first, then there is a horizontal resistance and the resistance from the upper bound of the down trend channel.
If WFMI cannot reach over the upper bound of the down trend channel, the $36 level should be closely watched, if there is a price break down at this level, the down trend will continue. If support is found at this level, WFMI will turn sideways.


