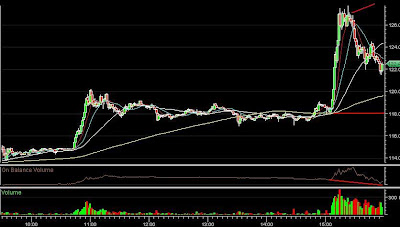
Let's first take a look at the daily chart: The green box and blue box are the shorting period when August data and September data were obtained. The red histograms are the volumes INCREASED during this period. The two red lines are the high end of short price and average short price in September. Today's rally could be viewed as a covering by shorters or short squeezing. However, if we look at the minute-wise chart for today, it seems another group of shorters are gaining strength at a higher price level.

Minute Chart:

The big jump today occured around 118 which is close to the average short price in September. This price triggered a set of short covering stop orders, with some fake news, the demand is mainly from shorter side. Then another group of people jumped in and dumped the stock as we can see from the decreasing trend of the OBV at the end of today's session.


No comments:
Post a Comment